
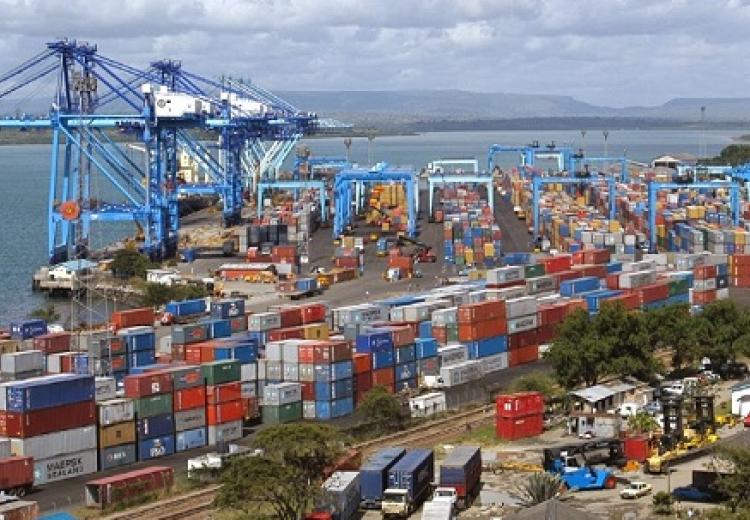
Mombasa Port volumes on the increase- from 24.88 million tons handled in 2014 to 26.7 million tons of cargo handled in 2015
The Port of Mombasa handles largely Import Cargo. In 2015, Mombasa Port handled 26.7 million tons of cargo, compared to 24.88 million tons handled in 2014. Import totaled 22.68 million tons from 20.77 million tons handled in 2014. Exports also increased to 3.53 million tons from 3.37 million in 2014.
Additionally, in 2015, about 504,848 Twenty Feet Equivalent Units (TEUs) of cargo were transported from the Port of Mombasa by trucks, while 14,248 TEUs went out by rail.
In 2014, Mombasa total Port Cargo throughput components; Imports and Exports (Containerized Cargo, Conventional Cargo, Dry Bulk & Liquid) and Transhipment, were 83.5%, 13.5% and 3% respectively.
Comparing 2013 and 2014 figures, imports through the Port of Mombasa increased by 0.7 million tons, exports by 1.13 million tons and transit by 0.48 million tons. Total increase in cargo throughput in 2014 compared to 2013 was 2.31 Million tons, a percentage increase of about 8.1%.
The ratio of exports to imports in 2014 was about 1:6, in 2013 it was about 1: 9. Much as there was significant improvement in the ratio of exports to imports in 2014, the imports greatly outweigh the exports creating balance of trade deficit.
Best performance for Maritime Indicators (Waiting time before berth and Ship turnaround time)
Another success story in the last quarter of the year 2015, was about the Maritime indicators where waiting time before berth, which is measured from the time the vessel arrives at the fairway buoy to the time at its first berth, has significantly improved beyond the target time of 24 hrs between October and December 2015.
The trend shows a continuous decrease in waiting time that further leads to an improvement in the ships turnaround time.
Ship Turnaround Time, which is measured from the time the vessel arrives at the fairway buoy to the time it is piloted off when departing the Port, registered its best performance of 3.1 days in October 2015, though still above the 3 day target.
Port Indicators Trend
The Northern Corridor Performance Dashboard, a monitoring tool with an online platform that can be accessed via http://top.ttcanc.org tracks ten key performance indicators on weekly, monthly and quarterly basis.
These indicators, which are part of over 31 indicators on the Transports Observatory Portal, are grouped into three categories which include; Port indicators, Corridor indicators and Maritime indicators.
One of the main purposes of the Dashboard is to monitor the implementation of the Mombasa Port Community Charter which was signed on 30 June 2014. The Charter commits both Public and Private Sectors to undertake measures that will increase efficiency of the Mombasa Port and the Northern Corridor.
During the last quarter of 2015, Containerized Cargo Dwell Time at the Port of Mombasa was on average 4 days (97.4 hours), still far from the target.
The dwell time is the measure of time that elapses from the time cargo arrives at the Port of Mombasa to the time goods leave the port premises after all permits and clearances have been obtained. It is measured by subtracting arrival time from the exit time at the Port.
As provided in the Mombasa Port Community Charter which commits both Public and Private Sector Stakeholders involved in the handling and clearance of goods transported through the Port of Mombasa, the Dwell Time target was set to be below 3 days (72 hours).
The trend can therefore be improved if policy measures and interventions in place as enshrined under the Port Charter are fully implemented and consistently put into practice.
“Dwell time improvement is a combined effort from the Management of the Port and other players in the Transport Industry”, said Donat M. BAGULA, the Executive Secretary of the Northern Corridor Transit and Transport Coordination Authority (NCTTCA).
“It is a good indicator for the performance of the Corridor which will impact on the competitiveness and reliability of the Transport Logistics chain in the Northern Corridor Region”, he added.
Equally, time taken at the Document Processing centre (DPC) for Transit Cargo increased from 2.3 hours to 3.4 hours from October to December 2015.This is the time it takes to have an entry lodged by a clearing agent passed by customs. And Time at DPC affects positively or negatively the Port Dwell Time for cargo on transit.
Additionally, One Stop Centre Clearance Time, which is measured by subtracting the time when an entry is passed from Release Time, has slightly improved from 2 days to about 1.8 days (47 to 45 hours) from October to November 2015.
Although the trend indicates a negative performance on One Stop Clearance time, all agencies involved are expected to take the lead role in their respective clearance stages to achieve a target of 24 hours.
Delay after customs release which refers to the period it takes to evacuate the Cargo from the Port after it is officially released by customs has also slightly worsened off from 1.5 to 1.8 days (37.1hours to 42.7hours) between October and December 2015. The trend shows slowness in the rate of Cargo pick up by transporters and the response time is still high compared to the 36 hour target.
According to Donat BAGULA, the Executive Secretary of NCTTCA, “delays after customs release is one of the areas to be addressed by shippers to continue reducing the Dwell time at the Port of Mombasa”.